Why Every Precious Metals Investor Needs a Live Metals Price Tracker

A live metals price tracker is a real-time tool that displays the current spot prices of precious metals — gold, silver, platinum, and palladium — pulled directly from global exchanges like COMEX and the LBMA, updated continuously throughout the trading day.
Here's what the best live metal price trackers show you at a glance:
| What You See | What It Means |
|---|---|
| Spot Price | The current raw market price for immediate delivery |
| Bid Price | What a dealer will pay to buy your metal |
| Ask Price | What you pay to purchase metal from a dealer |
| Daily Change (%) | How much the price has moved since market open |
| Gold/Silver Ratio | How many ounces of silver equal one ounce of gold |
| Exchange Source | Where the price data originates (COMEX, LBMA, etc.) |
Precious metals markets move fast. Prices shift in response to inflation data, interest rate decisions, geopolitical events, and currency fluctuations — often within minutes. Without a reliable real-time tracker, you're making decisions in the dark.
That's a costly problem. Whether you're timing a purchase, planning a sale, or simply protecting your wealth from economic uncertainty, knowing the exact price right now is the difference between a smart move and an expensive mistake.
I'm Eric Roach — former investment-banking and M&A advisor who has guided clients through multi-billion-dollar transactions on Wall Street, and now helps everyday investors use physical gold and silver as a reliable hedge against volatility. My institutional background in pricing, risk management, and macroeconomic analysis directly shapes how I approach a live metals price tracker as a core tool for any serious precious metals strategy. In the sections below, I'll break down exactly how these trackers work and how to use them to make smarter, more confident investment decisions.
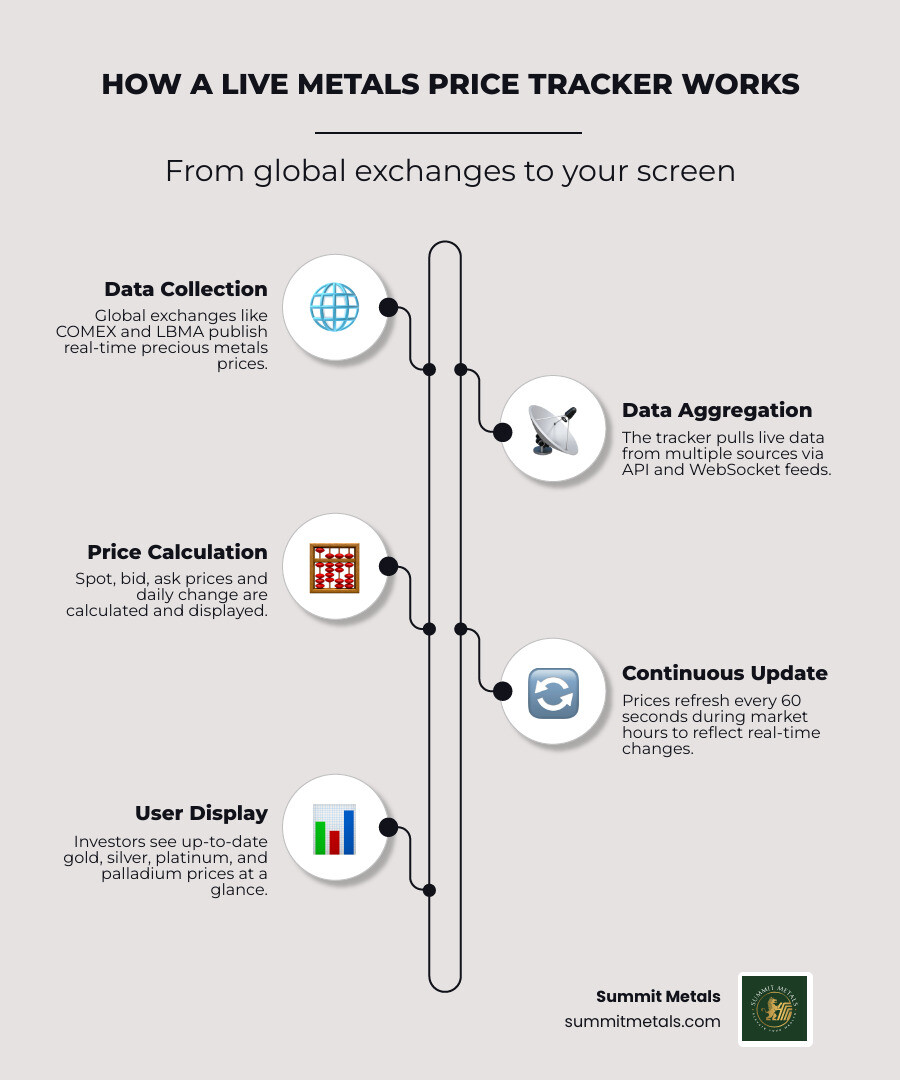
Quick live metals price tracker terms:
What is a Live Metals Price Tracker and How Does It Work?
At its core, a live metals price tracker is a specialized software application or web dashboard that aggregates data feeds from the world's primary commodities exchanges and institutional bullion markets. By translating raw financial data into a clean, readable interface, it allows retail investors to monitor global market movements instantly.
But how does this data get to your screen? The engine behind any high-quality tracker relies on two key technologies: application programming interfaces (APIs) and WebSockets.
Instead of requiring you to manually refresh a browser page, modern platforms like GoldTrack utilize WebSocket connections. WebSockets establish a continuous, open, two-way communication channel between the tracking server and your device. The moment a transaction occurs on the floor of the COMEX or an over-the-counter (OTC) trade is cleared in London, the price update is pushed directly to your screen—often in under 60 seconds.
This pricing data originates from several foundational global hubs:
- COMEX (Commodity Exchange): Located in New York, the COMEX is the primary futures exchange for gold, silver, and copper. It serves as the leading benchmark for real-time precious metals pricing in U.S. dollars.
- LBMA (London Bullion Market Association): London is the heart of the global over-the-counter physical gold and silver wholesale markets. The LBMA establishes the "London Fix" twice daily (at 10:30 AM and 3:00 PM London time), which acts as the global benchmark for settling physical contracts.
- LME (London Metal Exchange): The premier hub for industrial base metals (such as copper, aluminum, nickel, and zinc).
- Regional Exchanges: Platforms like MetalPrices.live aggregate data across seven global exchanges—including New York, London, Shanghai, Dubai, Istanbul, Tokyo, and Mumbai—to capture localized premiums and demand dynamics.
For a deeper dive into how these feeds translate to everyday market insights, check out our guide on Live Metal Prices: Your Daily Dose of Market Insights.
Key Market Mechanics: Spot, Bid, Ask, and Futures Prices
To navigate a live metals price tracker like a Wall Street professional, you must understand the distinct price types displayed on your screen. Relying on the wrong metric can lead to unexpected costs when buying or selling physical bullion.
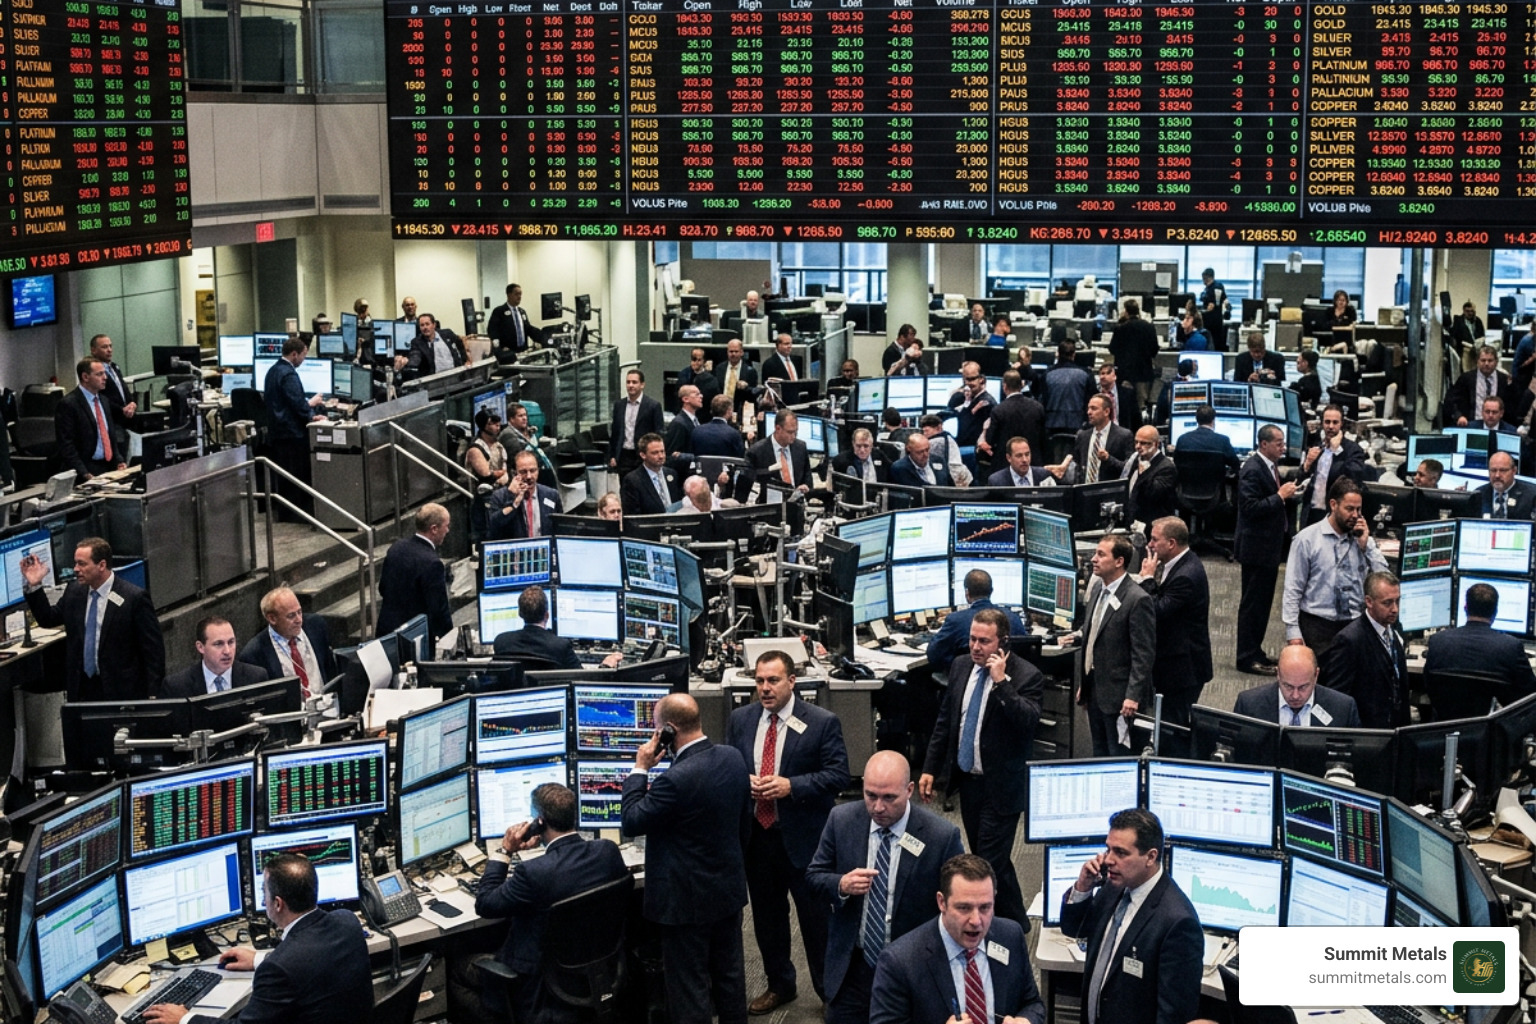
Here is a breakdown of the key pricing terms you will encounter:
Spot Price
The spot price represents the current market rate at which a raw, unrefined metal can be bought or sold for immediate delivery and payment. It is a highly liquid, constantly fluctuating benchmark driven by institutional trading.
Bid Price
The bid price is the maximum price a buyer (such as a bullion dealer) is willing to pay to purchase precious metals from you. If you are looking to liquidate your physical holdings, the bid price is your starting point.
Ask Price
The ask price (often called the offer price) is the minimum price at which a seller is willing to sell that same metal. When you are looking to buy, the ask price is the baseline before dealer premiums are added.
The Bid-Ask Spread
The difference between the bid and ask price is known as the spread. This spread serves as a direct indicator of market liquidity. A narrow spread means high liquidity and lower transaction friction, while a wide spread typically signals market volatility or lower trading volumes.
Futures Price
A futures price is a contract to buy or sell a specific quantity of metal at a predetermined price on a specified future date. On exchanges like the COMEX, the standard gold futures contract size is 100 troy ounces. While futures contracts heavily influence the spot price, they represent "paper" transactions that rarely result in physical delivery for retail investors.
To help visualize these differences and see why physical metal ownership is structurally superior to paper futures, we have mapped out their core characteristics below:
| Price Type | Primary Purpose | Settlement Type | Physical Security | Real-World Utility |
|---|---|---|---|---|
| Spot Price | Benchmark for immediate raw metal valuation. | Financial / Immediate | None (Paper baseline) | Used to calculate physical retail values. |
| Bid Price | The price a dealer pays to buy metal from you. | Immediate Cash | High (Traded for physical) | Essential for planning your investment exit strategy. |
| Ask Price | The baseline price you pay a dealer to buy. | Immediate Metal | High (Physical delivery) | The starting point for accumulating physical wealth. |
| Futures Price | Speculative paper trading and hedging. | Contractual / Delayed | Low (Subject to counterparty risk) | High risk of leverage; rarely results in physical delivery. |
While paper futures and spot indices are convenient for quick trading, they carry systemic counterparty risks. If a major financial disruption occurs, a paper contract cannot be held in your hand. Physical precious metals, on the other hand, represent tangible wealth with zero counterparty risk.
To track these daily movements in real time, explore our Live Spot Gold Price dashboard.
How to Use a Live Metals Price Tracker to Inform Investment Decisions
A live price tracker is not just a digital scoreboard; it is a tactical tool. Successful precious metals investing relies on disciplined strategies rather than emotional, short-term speculation.
One of the most effective ways to build wealth in precious metals is through dollar-cost averaging (DCA). Rather than trying to perfectly time the market—a strategy that experts discourage due to high-frequency volatility—DCA involves investing a fixed dollar amount at regular, structured intervals (such as monthly).
When prices are high, your fixed investment buys fewer ounces; when prices dip, your fixed investment automatically purchases more. Over time, this averages out your acquisition cost and removes the stress of daily market swings.
To make this strategy completely seamless, we offer the Summit Metals Autoinvest program. Think of it as a 401(k) for physical gold and silver. By setting up a recurring monthly purchase, you can systematically build a physical precious metals portfolio. We handle the vaulting or shipping logistics, allowing you to steadily accumulate tangible wealth without having to stare at a screen all day.
If you prefer to monitor the charts to optimize your manual purchases, you can easily track Gold Price Charts Live and check the Current Spot Silver Price Per Ounce to identify favorable entry points.
Analyzing Trends with a Live Metals Price Tracker
When examining interactive charts, it is easy to get lost in the noise of a 24-hour view. While short-term charts are excellent for identifying immediate intraday volatility, they often reflect temporary reactions to news events rather than genuine market directions.
To build a reliable investment thesis, you should analyze multiple timeframes:
- Short-Term (24h to 7 Days): Useful for timing immediate purchases during daily dips.
- Medium-Term (1 Month to 1 Year): Helps identify cyclical patterns, seasonal trends, and support levels.
- Long-Term (5 to 10 Years): Reveals the true macroeconomic trend, showing how metals preserve purchasing power through inflationary cycles.
By studying these historical charts, you can identify key support levels (the price floor where buying pressure typically stops a downward trend) and resistance levels (the price ceiling where selling pressure halts an upward move).
Tracking Ratios with a Live Metals Price Tracker
Another powerful feature of a comprehensive tracker is the ability to monitor metal-to-metal ratios, most notably the Gold-to-Silver Ratio.
As of July 19, 2026, the Gold/Silver Ratio sits at 71.90. This number indicates that it takes 71.90 ounces of silver to purchase a single ounce of gold.
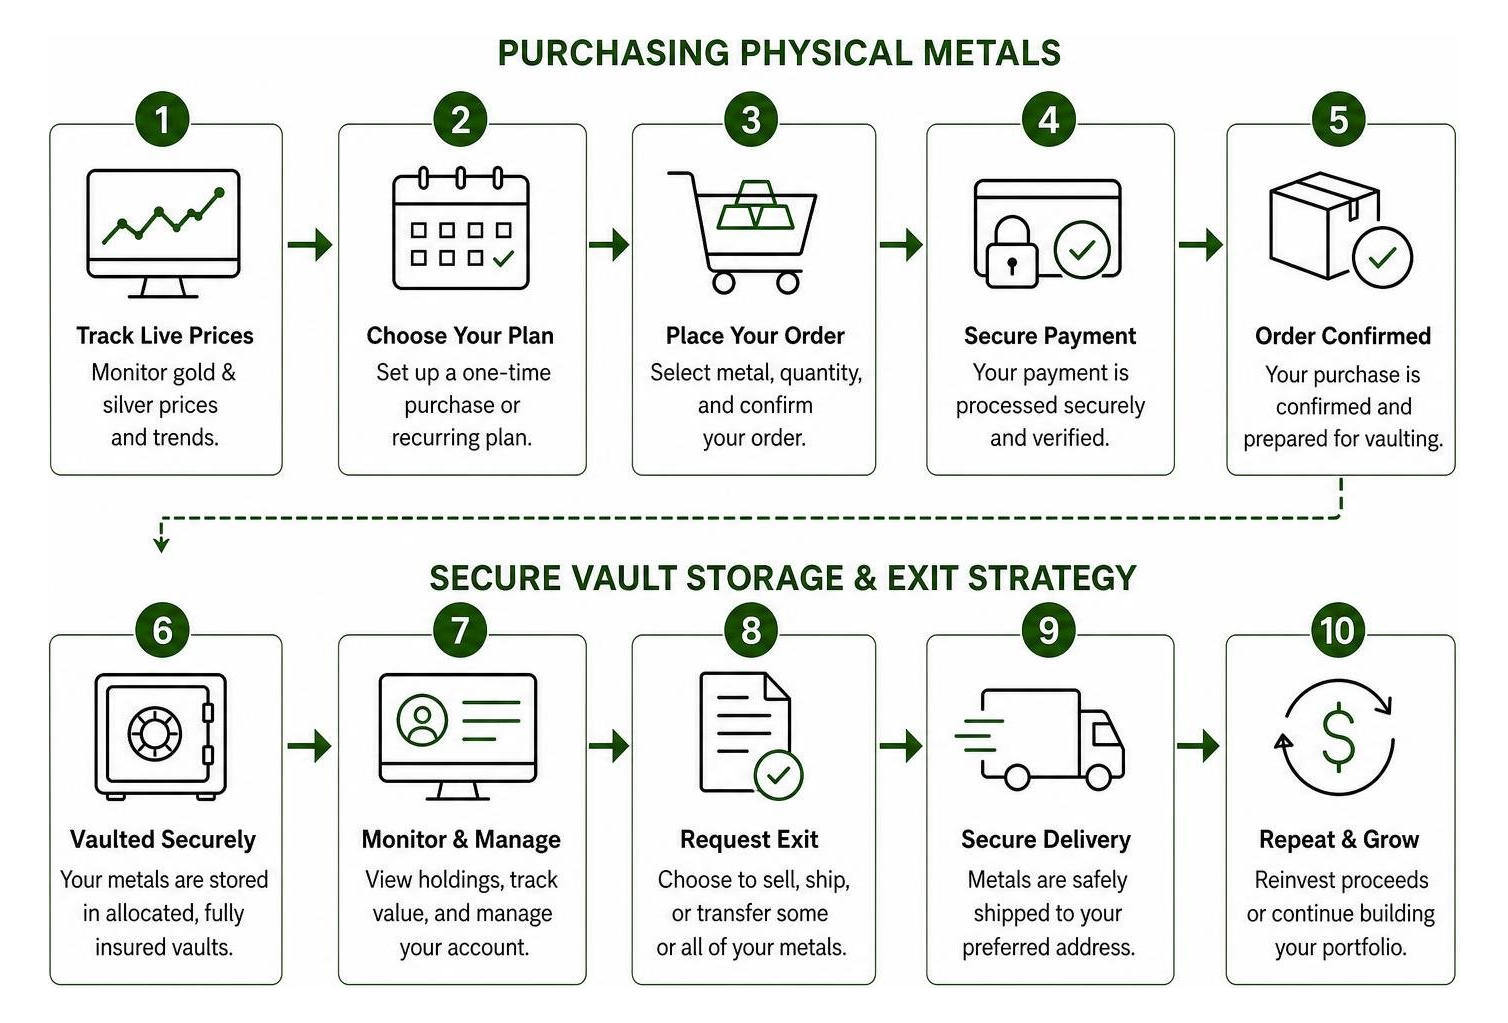
Investors use this ratio to identify relative value:
- High Ratio (e.g., above 80): Historically indicates that silver is undervalued relative to gold. Many investors will shift their capital toward physical silver at these levels.
- Low Ratio (e.g., below 50): Suggests that gold is undervalued relative to silver, prompting investors to swap some of their silver holdings back into gold.
By tracking these historical correlations, you can strategically allocate your physical portfolio to maximize long-term gains. Learn more about evaluating these assets in our analysis of Unlocking Value: Understanding Gold and Silver's Current Worth.
Physical Bullion vs. Paper Spot Prices: Understanding Premiums
A common point of confusion for new investors is why they cannot purchase a physical coin or bar at the exact spot price shown on a live metals price tracker.
The spot price represents the value of raw, unrefined, contract-sized metal sitting in an exchange vault. To turn that raw metal into an investment-grade product you can hold, several real-world costs must be added:
- Minting and Refining Costs: The physical expense of refining the metal to .999+ purity and striking it into coins or bars.
- Fabrication & Distribution: Packaging, international transit, and secure logistics.
- Dealer Premium: The small operational markup that allows retail dealers to provide authenticated inventory and secure shipping.

When choosing physical products, the shape and origin of your metal matter. To help you decide between gold coins and gold bars, consider the following comparison:
| Feature | Physical Gold Coins | Physical Gold Bars |
|---|---|---|
| Legal Tender Status | Yes (Backed by sovereign governments) | No |
| Face Value | Yes (Provides a government-guaranteed floor) | No |
| Built-In Fraud Protection | Extremely High (Sovereign anti-counterfeiting tech) | Moderate (Relies on assay cards) |
| Premium Over Spot | Higher (Due to intricate minting designs) | Lower (More cost-efficient raw weight) |
| Liquidity & Recognition | Instant global recognition | High (But may require testing upon resale) |
While bars offer the lowest premium per ounce, sovereign-minted gold coins provide unmatched security, government backing, and legal tender status that heavily protects them against fraud. For those looking to start with smaller, highly liquid weights, our Fractional Gold collections are an excellent entry point.
Planning Your Exit Strategy
Buying precious metals is only half the equation; a disciplined investor must always consider the exit. When you hold physical bullion, you need a secure way to liquidate your assets quickly at a fair price.
This is why we emphasize our secure Sell to us services. Rather than keeping all your physical metal at home—which can complicate insurance policies and increase security risks—many of our clients utilize secure, private vault storage. Keeping your metals stored in a verified, secure depository ensures maximum physical safety while maintaining absolute liquidity. When you decide to sell, you can instantly execute the transaction without waiting for shipping, transit verification, or local assaying.
Frequently Asked Questions About Live Metal Prices
Why do metal prices vary across different global exchanges?
Precious metals trade 24 hours a day across multiple international hubs. Prices can vary slightly between markets like New York (COMEX), London (LBMA), and Shanghai (SGE) due to localized supply and demand imbalances, regional import duties, and currency fluctuations. For example, the "Shanghai Premium" often reflects higher physical demand in China compared to Western paper markets.
How often are live metal prices updated?
On high-quality trackers using WebSocket technology, prices update every 60 seconds during active global market hours. This continuous data stream reflects active trading from Sunday evening (when Asian markets open) through Friday afternoon (when New York markets close).
What is the difference between a gold coin and a gold bar?
The primary difference is legal tender status. Gold coins are minted by sovereign governments (like the US Mint or Royal Canadian Mint), carry a face value, and feature advanced anti-counterfeiting technology. Gold bars are produced by private refiners, offer simpler designs, and carry lower premiums, making them highly efficient for bulk weight accumulation.
Conclusion
A live metals price tracker is an indispensable tool for navigating the modern commodities landscape. By understanding the mechanics of spot, bid, and ask prices, and tracking key indicators like the Gold-to-Silver ratio, you can make informed, data-driven decisions.
At Summit Metals, based in Salt Lake City, Utah, we believe in combining real-time transparency with physical security. We specialize in providing authenticated gold and silver precious metals tailored for serious investors. To ensure your peace of mind, all orders are shipped using secure, fully insured FedEx Express shipping after payments are thoroughly verified through our advanced fraud prevention protocols.
We are committed to investor education. If you want to learn more about the physical metals market, watch live testing of bullion, or hear directly from our team, subscribe to our educational YouTube channel to build your market knowledge.
Ready to diversify your portfolio with tangible, secure wealth? Explore our premier Silver collections today.