Why European Investors Track Gold in Euros
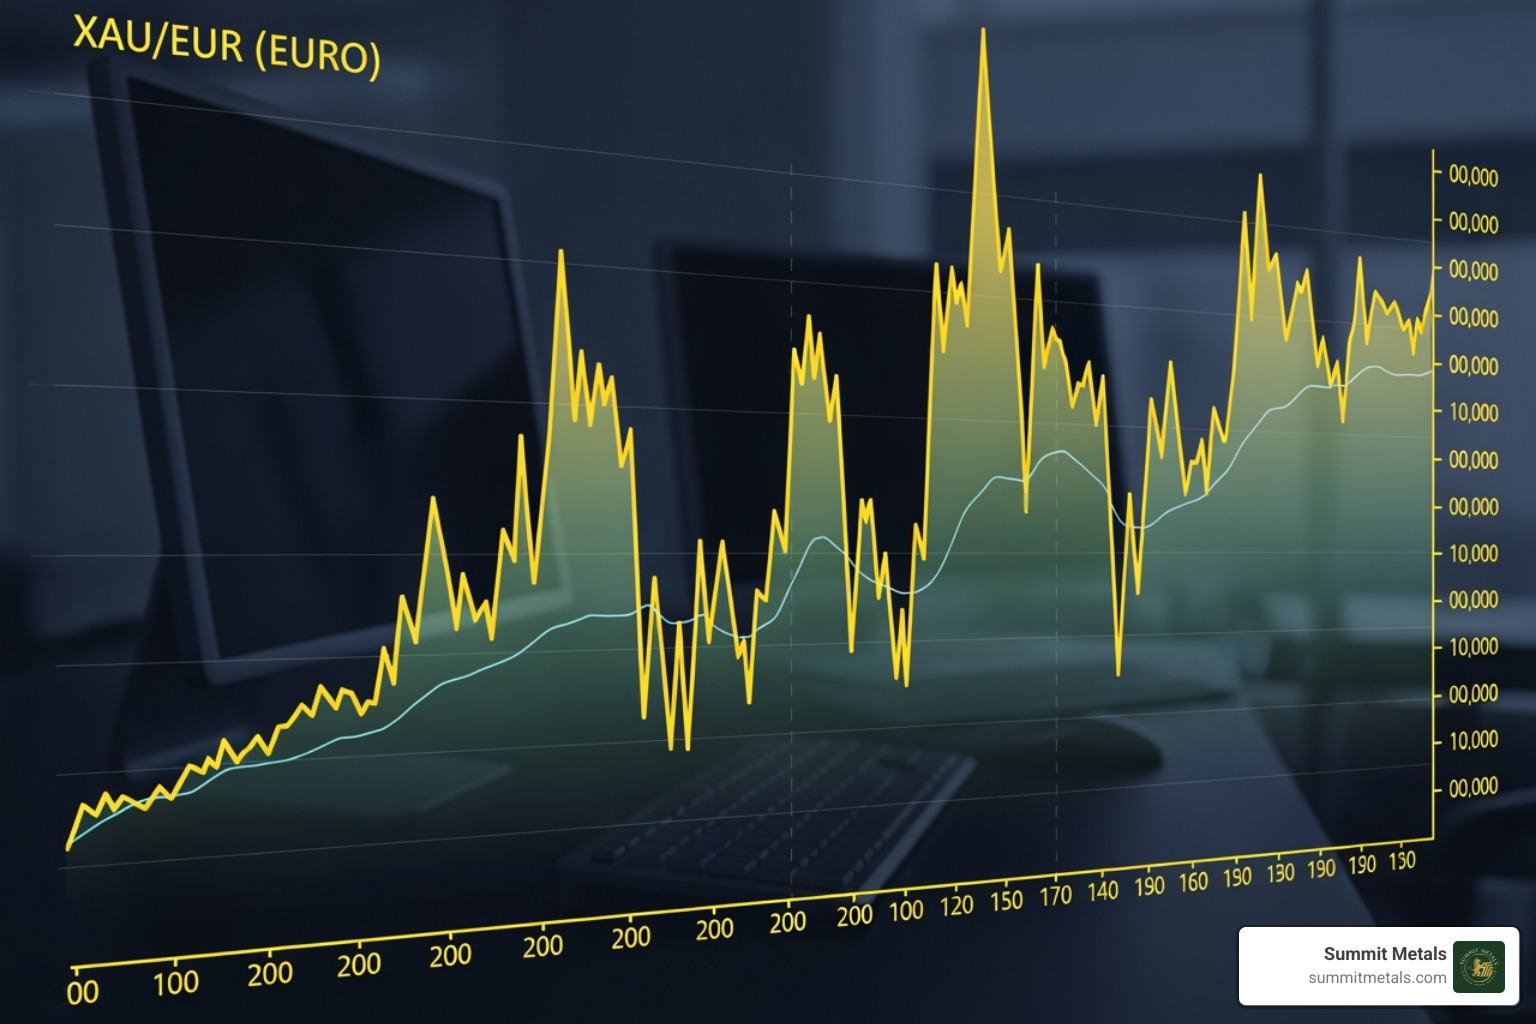
An eur gold chart (XAU/EUR) shows the price of gold in Euros. For European investors, it's the most direct measure of what they will pay for this critical safe-haven asset.
- Where to Find Charts: TradingView, XE.com, GoldPrice.org, and major bullion dealers.
- Common Units: Troy ounce (31.103g), gram, and kilogram.
- Key Timeframes: Live, 1-day, 1-month, 1-year, and 10-year historical views.
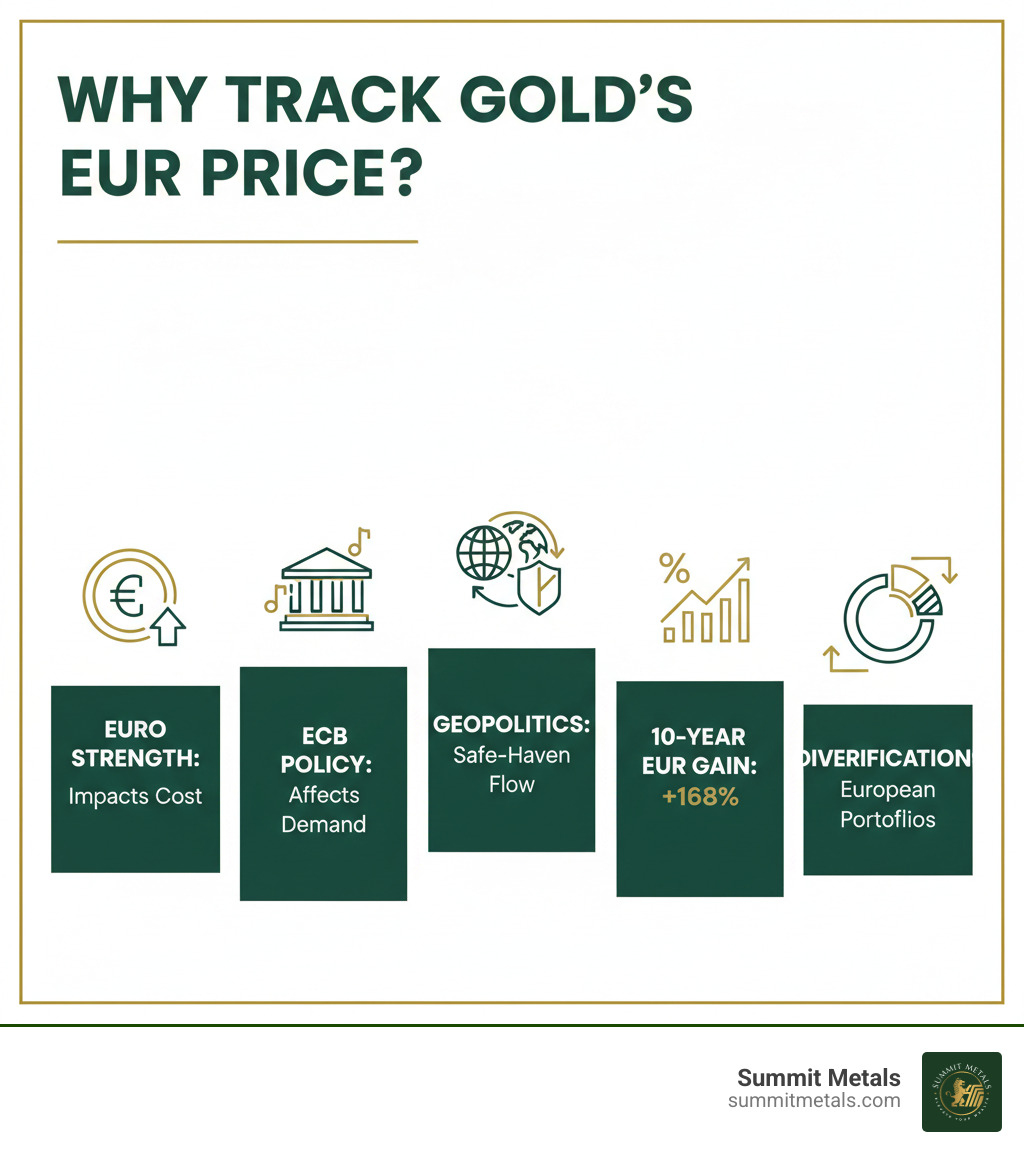
- 10-Year Performance: Gold has gained approximately 168% in EUR terms, climbing from lows near €970 to recent highs above €3,000.
Understanding the eur gold chart is crucial because the Euro's value directly impacts the cost of gold. When the European Central Bank (ECB) changes interest rates or geopolitical tensions rise, the price of gold in EUR can move independently of its USD price. This creates unique risks and opportunities for anyone holding Euros.
This impressive 10-year performance reflects gold's role as a hedge against inflation and currency devaluation, particularly given the economic pressures within the Eurozone. For European investors, tracking the eur gold chart is essential for timing purchases, recognizing long-term value, and building a diversified portfolio that protects wealth outside the banking system.
I'm Eric Roach. After a decade advising Fortune 500 clients on multi-billion-dollar hedging strategies, I now help individuals steer the precious metals markets with the same disciplined, risk-managed approach used on Wall Street.

How to Read and Access a Live EUR Gold Chart
Learning to read an eur gold chart is the first step for any serious gold investor. Fortunately, accessing live charts is straightforward. TradingView offers a user-friendly interface, while other excellent options include XE.com, GoldPrice.org, and GoldBroker.com. These platforms provide real-time spot prices and historical data, giving you a complete view of gold's performance in Euros.

Understanding Different Units of Measurement
The troy ounce is the global standard for pricing precious metals. One troy ounce equals 31.103 grams—slightly heavier than a standard ounce. When a chart shows a price like €3,460, it refers to one troy ounce.
However, gold is also sold by the gram and kilogram.
- Gram Pricing: Ideal for smaller purchases. To find the price per gram, divide the troy ounce price by 31.103. (e.g., €3,460/oz is roughly €111/gram).
- Kilogram Pricing: Relevant for large-scale investors. One kilogram contains 32.151 troy ounces. (e.g., €3,460/oz translates to over €111,000/kg).
Understanding these conversions helps you compare products and ensure you're getting a fair price, whether you're buying a small coin or a large bar from Summit Metals.
Finding Key Trends in the EUR Gold Chart
Reading a chart is about understanding context. As we explored in Why Gold and Silver Prices Fluctuate, central bank decisions and geopolitical events all influence the price. Different timeframes reveal different parts of the story.
- Daily movements reflect immediate market reactions to news, like an ECB announcement. They are useful for identifying specific entry points but can be volatile.
- The 1-month view helps identify emerging patterns, distinguishing between short-term noise and meaningful momentum.
- The 1-year chart shows how gold has performed through recent economic events and policy shifts, helping you gauge if current prices represent value.
- The 10-year historical perspective is the most powerful. The eur gold chart's 168% climb over the past decade demonstrates its role as a long-term wealth preserver through multiple economic cycles.
Studying long-term charts isn't about timing the market perfectly. It's about recognizing gold's consistent ability to protect purchasing power. This is why many smart investors use Summit Metals' Autoinvest feature to dollar-cost average their gold purchases. By investing a fixed amount monthly, like a 401(k) contribution, they smooth out volatility and build their holdings systematically.
For more detailed tools, explore our guide on Gold Prices Today Live Gold Price Chart Historical Data. The more comfortable you are with these trends, the more confident your investment decisions will be.
Key Factors That Influence the Gold Price in EUR
The eur gold chart reflects a complex interplay of economic forces, political decisions, and investor sentiment. At its core, gold follows the law of supply and demand. However, several key factors drive these shifts.

Inflation erodes a currency's purchasing power, making gold, a historical store of value, more attractive. Conversely, higher interest rates make bonds and savings accounts more appealing, as gold pays no dividend, potentially softening its demand. Geopolitical tensions and political uncertainty, especially within the Eurozone, drive investors toward gold as the ultimate safe-haven asset. Finally, central bank buying and steady industrial and jewelry demand provide a strong baseline of support for gold prices.
As detailed in Key Factors Influencing Gold Silver Prices: Supply Demand Geopolitics, these forces overlap and interact, creating the price movements we see on the chart.
The Role of the Euro and ECB Monetary Policy
The European Central Bank (ECB) is a primary driver of the eur gold chart. Its decisions directly impact the Euro's value and, consequently, the price of gold for European buyers.
- Currency Strength: When the Euro strengthens against the US dollar, gold becomes cheaper for Eurozone buyers. When the Euro weakens, the price of gold in EUR rises, even if the global dollar price is flat.
- Monetary Policy: The ECB's interest rate decisions are highly influential. Low rates or quantitative easing (money printing) reduce the opportunity cost of holding gold, typically pushing its EUR price higher. Conversely, raising rates to fight inflation can make interest-bearing assets more competitive, potentially dampening gold demand.
Political instability within the Eurozone can also weaken confidence in the currency, intensifying gold's appeal as a non-sovereign store of value. We explore these dynamics further in The Interplay of Interest Rates, the Dollar, and Gold Prices.
Comparing Gold in EUR to USD and Other Currencies
To fully understand the eur gold chart, you must compare it to gold's price in other currencies, especially the US Dollar. Gold is primarily traded in US Dollars (XAU/USD) on international markets, which serves as the global benchmark. The XAU/EUR price is derived from this benchmark via the EUR/USD exchange rate.
This means the eur gold chart can move for two reasons:
- The global (USD) price of gold changes due to global demand.
- The EUR/USD exchange rate fluctuates.
For example, if the Euro weakens against the dollar, the price of gold in Euros will rise even if the dollar price of gold is unchanged. This currency dynamic can be used as a hedge. If you anticipate Euro weakness, buying gold can protect your purchasing power.
Savvy investors compare gold's performance in EUR, USD, GBP, and CHF to determine if a price move is due to gold's fundamental strength or just currency fluctuations. The LBMA Gold Price, set twice daily, provides official benchmarks in multiple currencies, as explained at the LBMA Gold Price website.
How to Invest in Gold Using EUR Price Insights
Understanding the eur gold chart is a practical tool for making smarter investment decisions. Even for US-based investors in places like Wyoming or Salt Lake City, Utah, tracking gold's performance in Euros provides valuable insight into global market dynamics and currency movements.
At Summit Metals, we help you build tangible wealth with authenticated physical gold and silver, featuring transparent, real-time pricing. The eur gold chart can help gauge value and timing, whether you're buying gold bars or coins.
Interpreting the EUR Gold Chart for Investment Decisions
The chart reveals the interplay between currencies, economics, and investor sentiment.
- Identifying Entry Points: A dip in the EUR gold price might be caused by temporary Euro strength against the dollar, signaling a good buying opportunity. Conversely, a surge in the EUR price while the USD price is flat indicates Euro weakness—a key insight for anyone with international exposure.
- Recognizing Long-Term Value: Gold's 168% gain in EUR terms over the last decade demonstrates its power as a store of value through economic cycles and policy shifts. This long-term view helps investors focus on building a resilient portfolio rather than chasing short-term gains.
- Hedging Currency Risk: For those with international assets or a desire to diversify beyond the dollar, the eur gold chart shows how gold performs in a different currency environment, highlighting its role as a global hedge.
As discussed in [The Future of Gold and Silver Prices](https://summitmetals.com/blogs/guides-and-tips/the-future-of-gold-and-silver-prices), successful investing is about understanding these fundamental forces, not perfectly timing the market.
Choosing Your Investment: Gold Coins vs. Gold Bars
The choice between coins and bars depends on your investment goals. Both offer direct ownership of physical gold, but they serve different needs.
| Feature | Gold Coins (e.g., American Gold Eagle, Canadian Gold Maple Leaf) | Gold Bars (e.g., 1 oz, 10 oz, 1 kg bars) |
|---|---|---|
| Legal Tender / Face Value | Yes, carry a government-backed face value (e.g., $50 for a 1 oz American Gold Eagle), offering legal tender status and improved fraud protection. | No face value—purely valued for gold content. |
| Fraud Protection | High security through government minting, intricate designs, and legal tender status. | Relies on reputable refiners, serial numbers, and assay certificates. |
| Collectibility | May have numismatic value beyond gold content. | No numismatic value—focus is on weight and purity. |
| Liquidity & Divisibility | Highly liquid and easily divisible into smaller units (1 oz, 1/2 oz, etc.) for partial sales. | Larger bars are less divisible; smaller bars offer good liquidity. |
| Premiums | Higher premiums over spot price due to manufacturing costs and legal tender status. | Lower premiums over spot, making them the most cost-efficient way to buy in bulk. |
| Storage Efficiency | Slightly less space-efficient for the same weight. | Highly space-efficient for storing large quantities. |
Gold coins are an excellent choice for investors who prioritize security, global recognition, and divisibility. Their legal tender status, backed by a government, provides an extra layer of authenticity and fraud protection.
Gold bars are the most cost-efficient way to accumulate gold by weight. With lower premiums, especially for larger sizes, they are ideal for investors focused on maximizing their ounces per dollar.
Many savvy investors own both: bars for bulk storage and coins for liquidity. At Summit Metals, every product is authenticated, ensuring you can invest with confidence regardless of your choice.
A Smart Strategy: Dollar-Cost Averaging with Autoinvest
One of the most effective strategies for investing in gold is dollar-cost averaging—investing a fixed amount at regular intervals. This approach removes the stress of trying to time the market. When prices are high, you buy less; when they're low, you buy more, averaging out your cost over time.
At Summit Metals, our Autoinvest feature makes this effortless. You can set up automatic monthly purchases of authenticated physical gold or silver, building your holdings systematically, much like contributing to a 401k.
This disciplined strategy smooths out short-term volatility and ensures you are consistently building your tangible asset base. It's a simple, powerful way to accumulate wealth outside the traditional banking system, one ounce at a time. For investors in Wyoming, Utah, and across the US, Autoinvest provides a practical path to long-term financial security.
Frequently Asked Questions about the EUR Gold Chart
Connecting the price on an eur gold chart to the cost of physical gold can be confusing. Here are answers to the most common questions.
What is the difference between the spot price and the price I pay for physical gold?
The spot price shown on charts is the wholesale benchmark for large, electronic trades of unallocated gold between financial institutions. It does not include the costs of creating and delivering a physical product.
When you buy physical gold coins or bars, you pay a premium above the spot price. This premium covers the costs of manufacturing, minting, insurance, secure storage, and dealer operations. At Summit Metals, our transparent pricing clearly shows the spot price and any premiums, so you know exactly what you're paying for.
Why is gold priced in troy ounces?
The troy ounce has been the global standard for precious metals since medieval times and was officially adopted by the U.S. in 1828. One troy ounce is 31.103 grams, slightly heavier than a standard (avoirdupois) ounce of 28.35 grams. This precise, universal standard ensures consistency across international markets, whether you're looking at an eur gold chart or a USD price quote from the LBMA Gold Price.
Can I buy physical gold at the price shown on the chart?
No. The price on a live eur gold chart is the spot price, which is a reference for unallocated gold. Physical bullion costs more due to premiums for fabrication, authentication, and distribution. These premiums vary by product—for example, 1 oz coins have higher premiums than 1 kg bars.
At Summit Metals, we use real-time spot prices as our baseline and clearly display the final price for each product. The chart is your tool for tracking value, while our pricing shows the transactional cost of turning that value into a tangible asset. For more details on pricing, see our guide on Gold Price Today in USA per Gram.
Conclusion: Start Your European Gold Journey
Tracking the eur gold chart offers a valuable window into global currency dynamics and central bank policies, providing a more complete picture of the precious metals market for any investor.
The numbers are compelling: gold has gained nearly 168% in EUR terms over the past decade, proving its role as a hedge against inflation, currency devaluation, and economic uncertainty. This is a lesson that transcends borders.
At Summit Metals, we empower investors with transparent, real-time pricing for authenticated physical gold and silver. We believe the spot price on the eur gold chart is just the beginning; our mission is to deliver tangible assets at competitive rates.
Building a position in gold is accessible through our Autoinvest feature, which allows you to dollar-cost average with consistent monthly purchases, similar to a 401k. This disciplined approach mitigates volatility and builds real wealth outside the banking system. Whether you prefer the security of gold coins or the efficiency of gold bars, consistent investing is key.
Gold's story in Euros is a powerful reminder that while currencies fluctuate, gold endures. Let the eur gold chart inform your strategy, and let Summit Metals be your trusted partner in securing your financial future.
Ready to begin? Explore live gold price charts and begin your investment journey.


